About WebBased Monitoring System for Production (Spinning)
Data logging is the measuring and recording of physical or electrical parameters over a period of time. Some applications require only a single measurement, while others may require multiple channels and multiple types of measurements. Data loggers are available with various channel configurations: single-channel devices, multichannel devices, and modular devices with a mixture of measurement types. Data loggers can measure different types of signals and sensors including the following Production, Voltage, Current, Power Factor and Power Consumption
Why WMS 802.MS?
Using Data logger, we can identify the weak areas and can improve the same area immediately. The earliest form of recording data involved manually taking measurements, recording them to a written log, and plotting them on graph paper. In the late 19th century, this process was automated with the use of strip chart recorders that mechanically recorded measurements onto paper. Strip chart recorders were a great leap over manual recording but still had drawbacks.
Traditional data loggers are stand-alone box instruments that measure signals, convert them to digital data, and store the data to internal memory. Data must be physically transferred to a PC for visualization, analysis, and permanent storage.
PC-based data loggers, on the other hand, are a combination of a data acquisition device and a PC. Because the PC is actually a part of the system, the data logger can take advantage of the ever-increasing performance of the PC processor, hard drive, display, and I/O bus.
View more
Advantage of WMS 802.MS
This presents the following advantages over traditional stand-alone data WMS 802.MS
- Real-time visualization
- Inline analysis
- User-defined functionality
- Terabytes of data storage
- Network connectivity
Real-Time Visualization
With a traditional stand-alone data logger, you must first record the data and then manually transfer it to a PC before you can import it into a spreadsheet program or other tool to graph and visualize the data.
Because a PC-based data logger is always connected to the PC, live measurements are displayed on the PC monitor in real time and you can see results instantly. You can use programming environments, such as Web Based Software, to build custom user interfaces for controlling your measurement device and displaying the results. Creating a user interface with Web Based Software is as simple as dragging and dropping controls and graphs on the user interface.
Inline Analysis
Data analysis with a traditional stand-alone data logger is typically performed offline only after the data has been transferred to the PC.
Using a PC-based data logger, you can take advantage of multicore processors and increasingly available RAM in the PC to perform signal processing and analysis on your data as you acquire it. Web Based Software includes many common math and signal processing functions that use configuration wizards and make it easy to add analysis to your measurements.
User-Defined Functionality
With a traditional stand-alone data logger, you are generally limited to hardware and software functionality defined by the vendor. These functions are good for accomplishing general-purpose tasks, but they may not help you meet your unique application requirements. For example, you may want to log data only under certain conditions or generate custom alarms that aren't built into the data logger.
PC-based data loggers are software-defined instruments. This means the functionality of the device is defined by the software, and you can customize the software to meet your specific application needs. Using Web Based Software, you can easily build functionality for custom alarms, logging conditions, report generation, and signal analysis. You can log data to virtually any file format for importing into other tools and sharing data with others.
Terabytes of Data Storage
Data storage is an important component of a data logger. You can log only as much data as you can store in your data logger. Traditional stand-alone data loggers are limited by the amount of memory built into the device.
Because the PC is actually a part of a PC-based data logger, you are limited only by the amount of hard drive space on the PC. Today, it's not uncommon to find a PC hard drive with terabyte capacity that provides ample space for your current measurements as well as permanent storage space.
Network Connectivity
For applications that require long-term monitoring over days or weeks, you may have difficulty continually checking results. Remote monitoring is useful because you can see results from a remote location. Using a PC-based data logger, you can take advantage of the PC's network connectivity to transmit results over a network for remote viewing. With Web Based Software, you can create custom alarm conditions that send e-mails or even design a Web service that you can visualize over a Web-based application.
View more
Block Diagram for WMS 802.MS (Spinning)
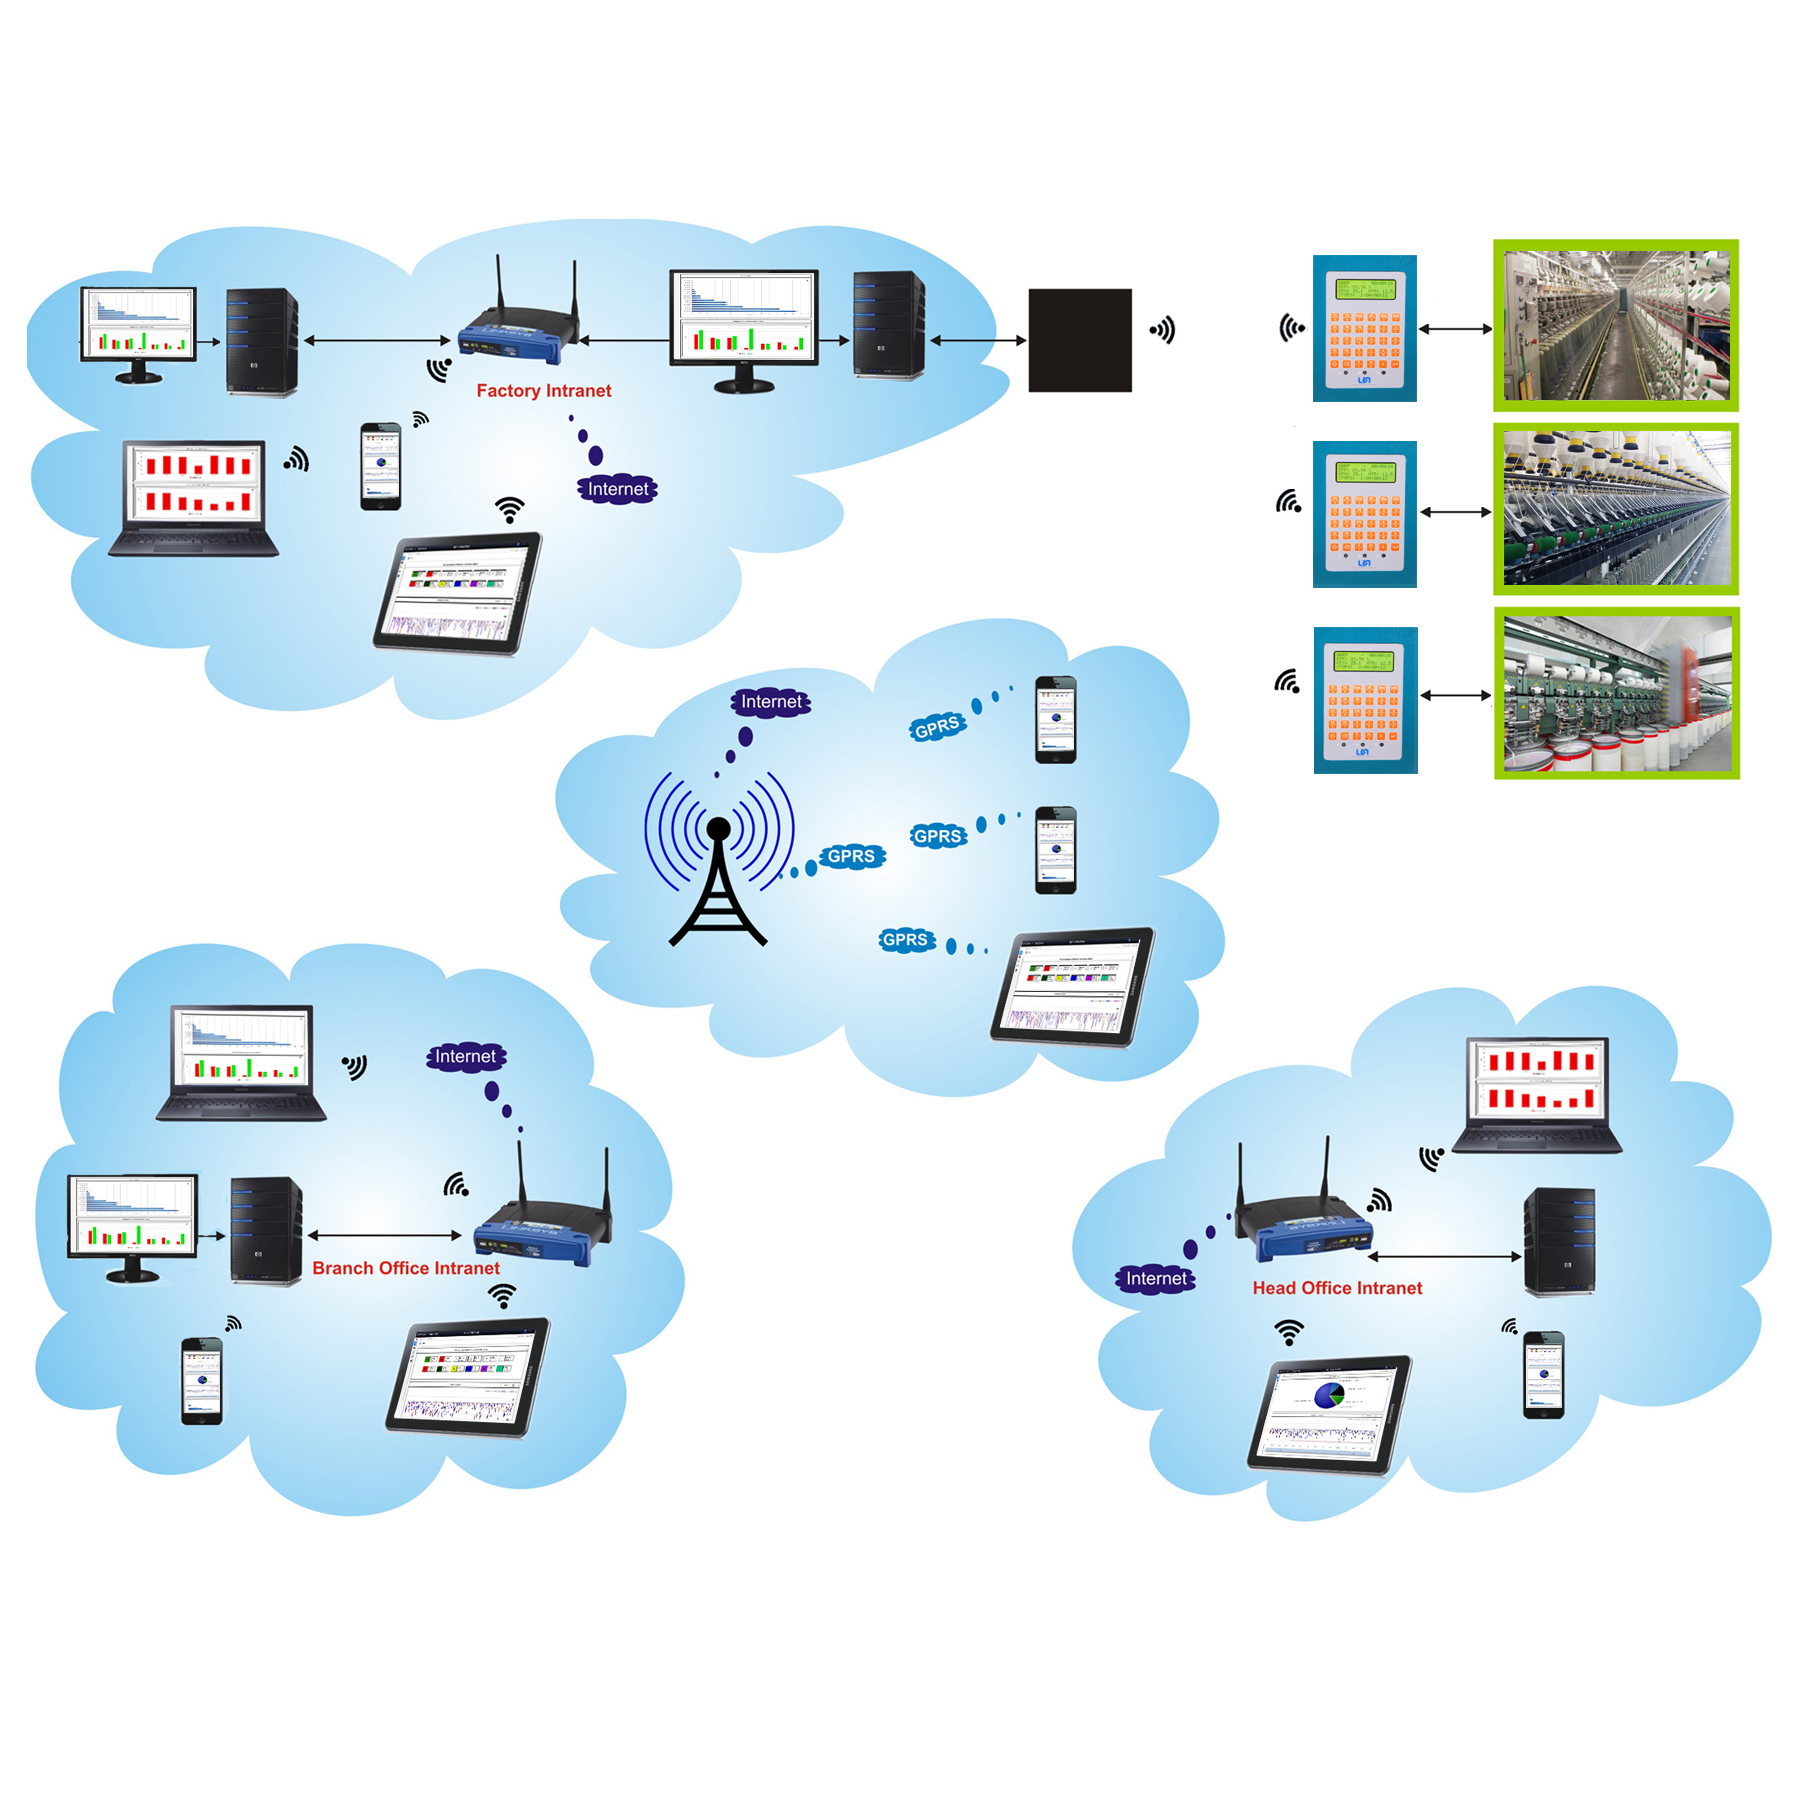
WebBased Monitoring System? WMS 802.MS (Spinning)
- Clarify Weak Areas
- Running Time
- Instantaneous RPM and Average RPM
- Production in Hanks
- Production in Kgs
- Various Stop Time
- Down Time with Duration
- Doff Stop with Duration
- Creel Stop with Duration
- Lapping Stop with Duration
- Other Stop with Duration
- Long Stops with Duration
- Employee Planning and Allocation.
- Employee Analysis.
Here are some more reasons for
WebBased Monitoring System WMS.802.MS(spinning)
- Data Logger System is a microprocessor based real time on-line Data Logging production monitoring system. It acquires data directly from the machines by means of signals. Data Logger automates the production and stoppages data directly to computer for spinning departments.
- Doff, Manual and Other stoppages are directly recorded to computer as Doff, Manual and Other stoppages. This greatly helps the management to control the stoppage variation and thereby to improve productivity.
- For every stoppage, Data Logger records the start time and end time of the stoppage against the machine, shift and date. The user is allowed to change a suitable reason for such a stoppage from the existing stop reasons at the end of a shift or latter on. Also, the user is allowed to eliminate certain type of stoppages for which the duration is less than out of production time so and which are not considered while production calculation. This greatly improve the accuracy in production calculation.
- On-line Data Logging production monitoring system information with respect to RPM, Production, Efficiency and Stoppages are available to the user up to the minute.
- User friendly Web based Software. User can monitor the industry anywhere from the world through Internet. Integrated information of all Machines at one place.
Monitoring Screen to show current month, Previous Shift, Previous Day and current shift status with easily understandable user friendly GUI.
- Dash board for cumulative display of collected data in a single page. Running and Stoppage machines with their percentage. Efficiency wise machines counting with percentage. Instantaneous and Running shift efficiency and production data in the dash board view.
- Various Reports on Production, Stoppage & Efficiency based on selected criteria.
- Each detailed report will say the working machine's for the day performance along with the up to date performance is the special quality of Data Logger software.
- Performance of any Machine, Design, Employee or Group can be analyzed at any point of time for any chosen period of working. For any chosen period can be analyzed.
- Design Changes for completed shifts with high level authentication.
- Real time and past data comparison on Machine, Design, Operator, Technician, Supervisor, Operator Group, Technician Group, Supervisor Group, Buyer, Order etc.,.
- Periodical Break analysis and Efficiency Graphs to improve Production and Quality.
- Production Planning and Order status Reports.
- Projected Production information to improve current shift Production & Efficiency.
- Our Data Logger software allows the user to input worker's planning and existing men allocation and details.
- Total working performance of Mills for last shift would be immediately available to the current shift Executives.
- Total working performance of the Mills for a day would be immediately available after the end of the day to the Top Executives. Month end Production report and stoppages analysis reports are immediately available after the month end without any manual preparation.
- There is no manual calculation and integration is required at any point of time for any kind of report.
- As the production parameters are directly recorded from the machines, the special efforts of the system can be realized and the time reduction in the clerical work can be understood.
- Data Logger software is also allows direct input for production and other working details. Which are not censored by Data Logger system. This helps the management to have total production monitoring through computer. The management can realize the completeness in computerizing the production activity.
- In most of the reports Mills standard has been compared.
- More than 200 different kinds of reports are available. Each of these reports are carefully designed and are very meaningful to control the production routines in all respects.
- Graphical representation of data with respect to productivity and stoppage are also available for quick and easy understanding of the Mills performance.
Features
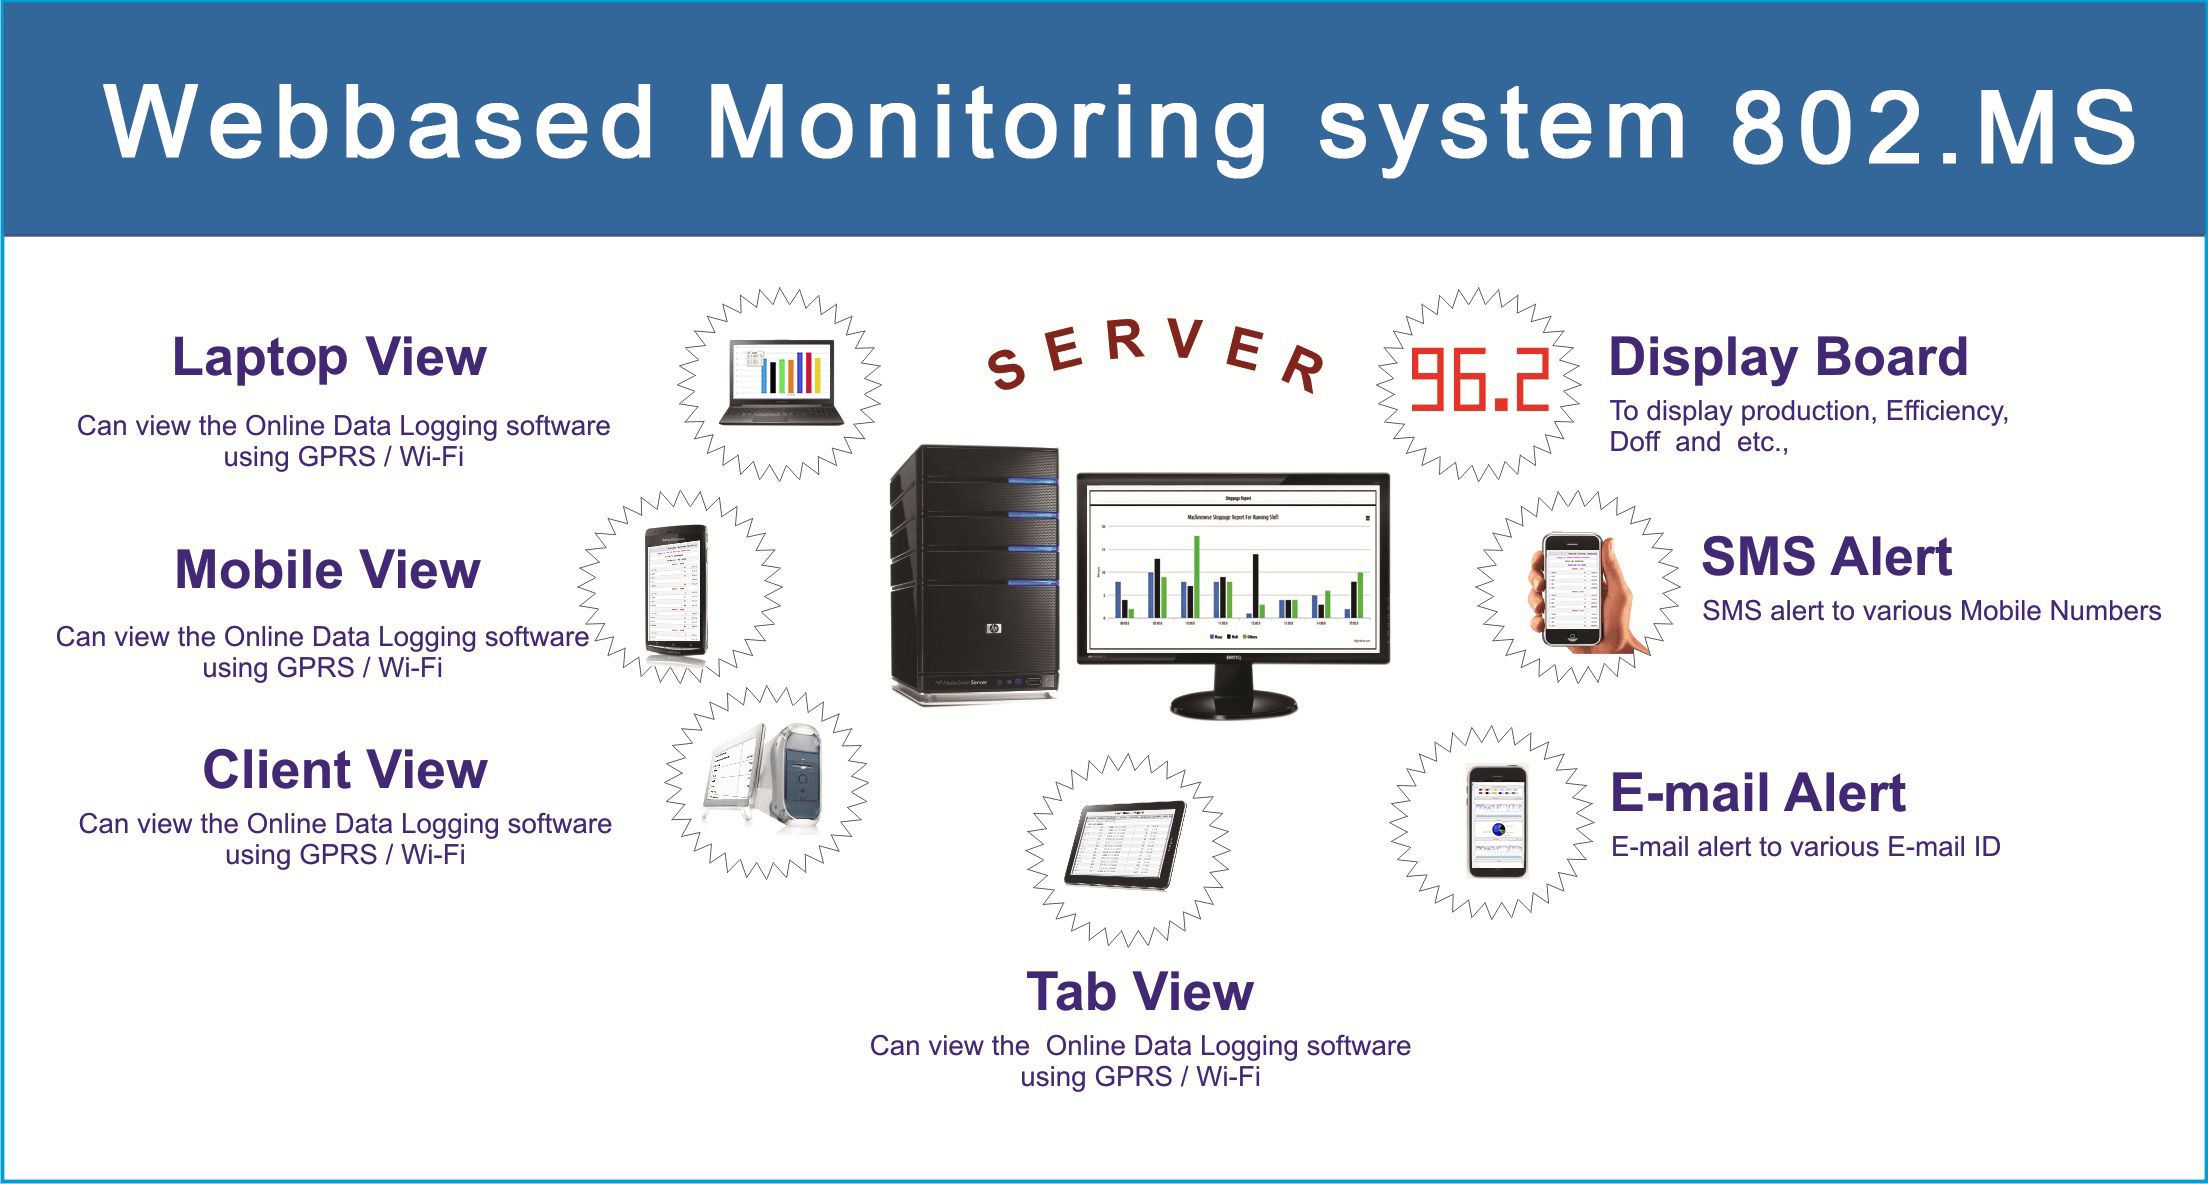
- ERP Interface.
- SMS Alerts (Optional).
- Provision to send reports by e-mail automatically (Optional).
- Provision to connect big LED / LCD screens (Optional).
- Provision to show Running Display.
WMS 802.MS Device Features
- Rugged, Dust & Oil proof Cabinet and feather touch keypad with 2- Line LCD for Data Terminal.
- Provision to Enter Stop Codes.
- Total and Individual stops with their duration.(Optional).
- Less Maintenance.
- Production & Efficiency Related information can be viewed for Running Shift and completed last 2 shifts at Data Terminal.
Specifications
|
Details |
|
|
| Processor |
8-bit Microcontroller, 16-bit Microcontroller(Optional), 32-bit Microcontroller(Optional), ARM7 Processor(Optional) |
|
|
| Program Memory |
64 KB, 512KB(Optional) |
|
|
| SRAM |
4 KB, 128 KB(Optional) |
|
|
| Operating Firmware |
Embedded C |
|
|
| Display |
16X2 LCD, 16X4 LCD(Optional) 20X2 LCD(Optional) 20X4 LCD(Optional), Monochrome Graphical LCD 128X64 (Optional) |
|
|
| Signal |
Manual, Doff, Signal3, Signal4, Signal5, Signal6, Doff Indication(Optional), Communication On/Off Indication(Optional), Automatic Stop For Machine Signal(Optional) |
|
|
| KeyPad |
4X4 Matrix, 5X5 Matrix(Optional), 6X5 Matrix(Optional) |
|
|
| Barcode |
2D/3D Barcode |
|
|
How it Works
Web or intranet server to make production information and data available to engineers, customers, and representatives who need quick access to that data. In order to access the data, the user needs to know the address (URL) of the production monitoring data site(s), have a Web browser such as Netscape Navigator or Microsoft Internet Explorer, and have the required passwords to enter the system. The request from the user and sends an HTML file back to the user, which is viewed with a Web browser.
The user may view a RMS report, which may contain an event list, histogram table, curve, and/or 3D Histogram. A time range filter is applied to the request, and the report is sent back to the user.
The date and time ranges are entered, the monitoring site(s) is selected, and the desired produciton monitoring information is selected. The request is sent to the back-end server, and the results are displayed.
View more
What Can be Viewed?
The software allows viewing of all data that has been previously downloaded from the monitoring instruments using the monitor’s proprietary software and stored on the network server. For example, if an engineer is looking for events that occurred during the previous week, a password is entered, sites of interest are selected, and the date and time of interest are entered. An event list is returned, and the user may view each event in more detail. The events are viewed individually by phase.
The disturbance detail feature allows the user to view all aspects of an event. Cycle-by-cycle RMS summaries and waveform captures can be used for event analysis and troubleshooting. Data such as this is now immediately available to such groups as control room operators, system protection engineers, customer service representatives, and any other employee connected to the Con Edison network. Access is available across a range of operating systems, including Windows, OS2 and UNIX.
View more